
Hey there! Let’s dive into how to read a fish finder, it’s not as complicated as it might seem. Think of it like a special underwater camera that uses sound to see:
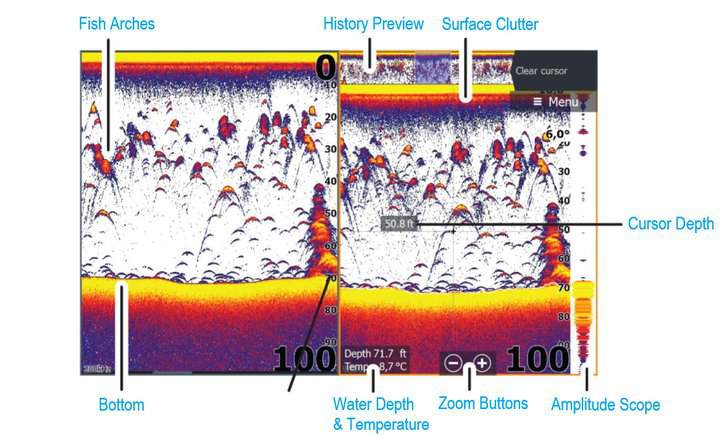
- The Screen Basics: When you look at the fish finder screen, you’re basically seeing a sonar snapshot of what’s under the water. The top of the screen shows the surface, and the bottom line shows the lake or sea bed. Everything in between? That’s the water column where we find fish.
- Spotting Fish: Fish show up as little arches or fish icons. These shapes are the fish finder’s way of saying, “Hey, there might be a fish here!” The size of the arch can tell you about the size of the fish.
- Depth: Notice the numbers along the side of the screen? That’s how deep the water is right under us. It helps us know how deep we should be fishing. If the screen shows fish at 20 feet, that’s where we should try to get our bait.
- Water Temperature: Some fish finders show the water’s temperature. This is cool because certain fish like certain temperatures. It helps us decide where to fish, especially during different seasons.
- Bottom: The bottom of the water shows up as a solid line. How thick or thin it is can tell us if the bottom is soft mud or hard rock. Fish like different kinds of bottoms, so this is super useful.
What do Fish Look Like on Fish Finder
Fish typically appear as arches or lines on traditional sonar due to the boat’s movement over them. In down imaging, fish look like small dots or blobs, often with shadows behind them, indicating their position in the water column. In side imaging, fish appear as bright white dots or streaks, with shadows that can provide clues about their height off the bottom.
Below is a more detailed explanation of what fish look like on different sonar types.
Traditional Sonar
On traditional or CHIRP sonar, fish are typically represented in the following ways:
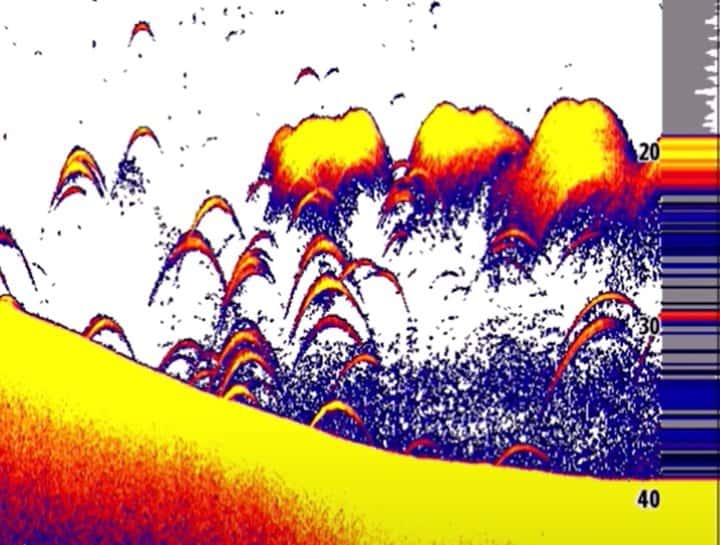
- Arches: The most common representation of fish on traditional sonar is arches. These arches form due to the boat’s movement over stationary fish. As the sonar beam first makes contact with the fish, it begins to draw the arch, which peaks when the fish is directly under the transducer and then diminishes as the boat moves past the fish. The size and color intensity of the arch can give clues about the size and position of the fish relative to the transducer.
- Half Arches or Check Marks: If you see half arches or shapes resembling check marks, it could indicate that the fish are on the edge of the sonar beam or that the transducer might not be properly aligned.
- Lines: If the boat is stationary or moving very slowly, fish appear as straight horizontal lines rather than arches because they remain in the sonar beam for a more extended period.
- Dots or Small Blobs: On some traditional sonar displays, especially when the fish are not directly beneath the transducer or if the fish are very small, they may appear as dots or small blobs.
- Dense Clouds: Fish schools typically appear as dense clouds or clusters of dots or arches, often showing a stronger color intensity in the center, indicating a denser concentration of fish. The shape and density of these clusters can provide clues about the size and type of the baitfish present.
- Fish Size: Traditional sonar uses color palettes to indicate the strength of the return. For example, a strong return from a big fish or a fish directly in the center of the sonar beam appears in warm colors like red or yellow, while weaker returns might be shown in cool colors like blue or green.
- Position in the Water Column: By looking at where the arches or dots appear on the sonar screen, you can determine the depth at which the fish are located. This is useful for setting your fishing depth accordingly.
Down Imaging
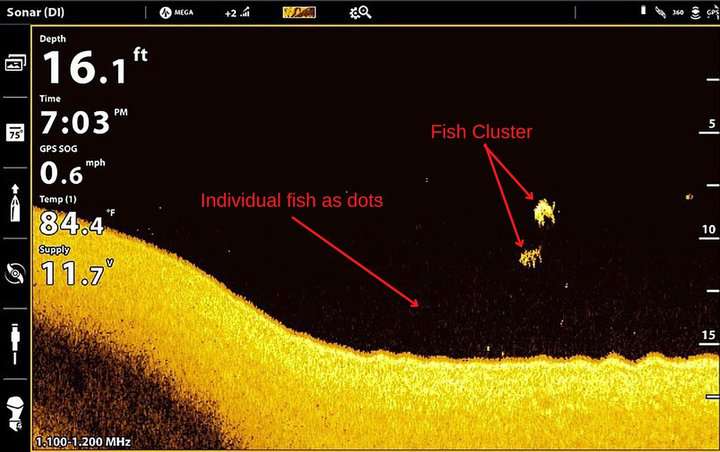
On down imaging (DI), fish typically appear differently than on traditional sonar. Here’s what fish look like on down imaging:
- Dots or Small Blobs: The most common representation of fish on DI is as small dots or tiny blobs. These dots can be isolated or clustered together, depending on whether the fish are solitary or schooling.
- Shadows: Behind many of these dots or blobs, you might see a faint shadow. The shadow is created because the fish interrupts the DI signal, preventing it from reaching directly below the fish. This shadow can help confirm the presence of fish, especially when it’s consistent with the direction and angle of the DI beam.
- Location in the Water Column: Just like traditional sonar, the vertical position of the dots on the screen indicates the depth of the fish. You can determine how deep the fish are by looking at their position relative to the water’s surface and bottom.
- Baitfish vs Game Fish: Baitfish often appear as tightly packed clusters of dots or blobs, resembling a cloud. Game fish will typically appear as distinct, solid marks, separated from each other.
- Fish Near Structures: On DI, it’s easier to distinguish between fish and structures. Fish near the bottom or close to other structures like weeds, rocks, or timber can be identified by the slight separation or gap between the fish dot and the structure. This clarity is one of the advantages of DI.
- Size and Shape: While traditional sonar might depict larger fish as bigger arches, on DI, the size of the dot isn’t always a direct indicator of fish size. However, larger targets (like big fish or tightly grouped schools of baitfish) appear as slightly larger or elongated blobs.
Side Imaging
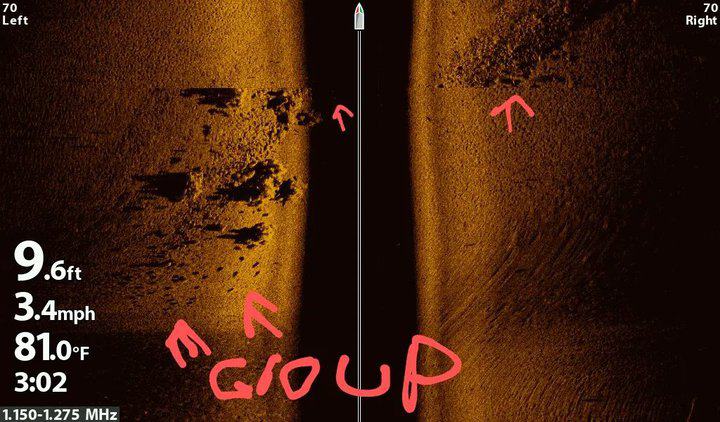
Here’s how fish appear on side imaging:
- White Dots or Streaks: Fish typically appear as bright white dots or streaks on the screen. The reason they’re bright is that they reflect the sonar signal well, making them stand out against the darker background.
- Shadows: Just like in down imaging, fish on side imaging often cast shadows. These shadows are created when the fish interrupts the side imaging beam. The distance between the fish dot and its shadow can indicate the fish’s height off the bottom. A longer shadow can mean the fish is suspended higher in the water column.
- Clusters or Schools: Individual fish will be seen as singular dots or streaks. In contrast, schools of fish can appear as clusters of dots or more substantial bright areas, especially if the school is dense.
- Fish Near Structures: One advantage of side imaging is its ability to distinguish fish from structures clearly. Fish near logs, rocks, or other underwater features can be identified by the white dots near or around these structures. The shadows cast by both the fish and the structures can provide additional context.
- Orientation: The orientation of the fish to the boat and the SI beam can impact how they appear. Fish that are oriented perpendicular to the boat’s path might appear as longer streaks, while those parallel to the boat’s path might show up as dots.
- Depth and Distance: The position of the dots or streaks on the screen indicates their relative location. Marks closer to the centerline of the display are closer to the boat, while those further out are farther away. Some side imaging systems also offer depth markers or overlays to help gauge the depth of detected objects.
- Brightness and Size: Larger fish or schools of fish can produce brighter and slightly larger marks on the screen. However, it’s essential to note that the brightness can also be affected by the fish’s composition (like its air bladder) and orientation to the sonar beams.
- Background and Clutter: The background on side imaging is usually darker, helping fish and other objects stand out. However, debris, bubbles, or other suspended particles can sometimes produce clutter or noise, which might require adjustments to the SI settings for clearer images.
Reading Other Details on Fish Finder
Depth
Let’s talk about how to read the depth on a fish finder, which is super important for figuring out where the fish are hanging out.
- Depth Readings: First, look at the numbers along the top or the side of the fish finder screen. These numbers show the depth of the water directly beneath us. It’s usually measured in feet or meters.
- Continuous Updates: The fish finder constantly updates this depth as we move around, so you’ll see it change in real time. This helps us understand if we’re getting into shallower or deeper water.
- Depth Scale: On the side of the screen, there’s often a scale or a line that moves from top to bottom. This scale represents the water depth from the surface down to the bottom. It helps you visually gauge how deep the water is at any point.
- Relating Depth to Fish: When you spot fish symbols or arches, they’ll be positioned along this scale. This tells us how deep the fish are. So, if we see fish arches halfway down the screen and the depth at the bottom is 40 feet, those fish are around 20 feet deep.
- Adjusting Your Fishing Technique: Knowing the depth is crucial because it tells us how deep to cast our line or how far to let down our lure. If the fish are 20 feet deep, we need to make sure our bait gets down to that level.
So, by keeping an eye on the depth readings and where the fish show up in relation to those depths, we can really dial in our fishing strategy. It’s like having an x-ray of the water – pretty cool, right?
Bottom Composition
Understanding the bottom composition of a body of water is pretty cool and useful when you’re using a fish finder. Here’s how you can read it:
- What is Bottom Composition?: It’s basically what the bottom of the lake, river, or sea looks like – whether it’s muddy, sandy, rocky, or covered in vegetation. Fish like different types of bottoms for feeding and hiding, so knowing this can help us fish more effectively.
- Identifying Bottom: On your fish finder, the bottom is shown as a line. How this line looks can tell us a lot about the bottom composition.
- Hard Bottom: A hard bottom, like rock, usually shows up as a thin, strong, and consistent line. It means the sonar signal is bouncing back quickly.
- Soft Bottoms: If the bottom is soft, like mud or silt, the line will appear thicker and less defined. This is because the sonar waves sink into the soft material a bit before bouncing back, so the signal is weaker.
- Vegetation: Sometimes, you’ll see little spikes or fuzz coming up from the bottom line. This often means there’s vegetation, like weeds or plants, which can be great spots to find fish, especially bass.
- Transition Areas: Keep an eye out for places where the bottom composition changes, like from sand to rock. These transition areas are often hotspots for fish activity.
- Experience Helps: The more you use your fish finder, the better you’ll get at reading these signals. Sometimes what you see might be a bit confusing, but with experience, you’ll start to understand the subtle differences.
Remember, different fish like different bottoms. Knowing what’s under the water helps us decide where to fish and what kind of bait or lure might work best. It’s like being a detective, but for fishing!
Reading Different Fish Finder Brands
Fish finders, regardless of the brand, operate on similar principles, but each may have unique features and user interfaces. Here’s a basic guide on how to read the three best fish finder brands in the market.
Garmin Fish Finder
Garmin fish finders display depth, water temperature, and boat speed at the top of the screen, with the main portion dedicated to sonar returns.
One of the features offered by Garmin models is Fish Symbols, which display fish as small icons. While helpful for beginners, many seasoned anglers prefer viewing raw sonar data.
In terms of structure, hard returns, like the bottom or submerged rocks, manifest as a thick, solid line, while softer bottoms might show as a thinner line.
Garmin fish finders come equipped with CHIRP, DownVu (Down Imaging), and SideVu (Side Imaging) offering detailed sonar images below and to the sides of the boat.
Humminbird Fish Finder
The Humminbird fish finder interface typically shows depth, temperature, and boat speed at the bottom. The main view showcases the sonar return.
Humminbird is renowned for its Side Imaging and Down Imaging technology, offering a picture-like representation of the area below and to the sides of the boat.
In traditional 2D sonar, moving fish often appear as arches, with the arch’s peak indicating the fish’s depth. Regarding structure, solid objects like rocks will display as dark, thick lines or areas, whereas vegetation may appear as either sparse or dense patches, depending on their thickness.
Lowrance Fish Finder
Lowrance fish finders have a similar layout, with depth, boat speed, and water temperature displayed at the top, while the primary focus remains on sonar views.
An interesting feature is the Fish ID, which portrays fish as icons, indicating their depth. The color palette in the sonar return is indicative of return strength. Red, for instance, typically represents a strong return, suggesting hard structures or the bottom. In contrast, softer structures or fish might appear in shades of yellow or green.
Lowrance’s StructureScan is their proprietary version of side and down imaging, offering users a clear, image-like view of the underwater terrain. Lowrance models also feature FishReveal which displays fish as arches in DownScan by overlaying traditional sonar on the DownScan Imaging screen.
How to Identify Different Fish Species on Fish Finder
Identifying specific fish species on a fish finder requires practice, as sonar returns often look similar for different species. However, certain clues and patterns can help you make educated guesses. Here’s how you might differentiate between Crappie, Catfish, and Bass on a fish finder:
Crappie
Crappie are known to school, especially in open water. On the fish finder, they may appear as tight clusters or groups of dots/arches.
Crappie often suspend in the water column, especially around structures like submerged trees, brush piles, or drop-offs. If you notice a group of arches or dots suspended mid-water or near a structure, it could be a school of Crappie.
It’s also worth noting that the sonar arches for Crappie tend to be smaller and less defined when compared to larger fish species like Bass or Catfish. The best fish finder for Crappie is one that offers high-resolution imaging and allows for detailed views of submerged structures where Crappie often congregate.
Catfish
Catfish are often found near the bottom. If you see arches or dots hugging the bottom contour or just above it, you could be looking at Catfish. They often produce thicker, elongated arches on the fish finder due to their longer body shape. Unlike Crappie, Catfish are less likely to be found in tight schools. They may be alone or in small groups.
The best fish finder for Catfish is one that offers a combination of high-resolution down imaging and traditional sonar to effectively locate catfish near the bottom or in structures.
Bass
Bass are known to relate closely to structures like rock piles, submerged trees, weed lines, and ledges. If you see defined arches near such structures on the fish finder screen, it might be Bass. While Bass can be found throughout the water column, they are often seen in mid to bottom depths, especially around cover.
Bass arches on fish finder will generally be more defined and larger than Crappie but might be similar in size to Catfish. The key is to look at their relation to structures and their depth in the water column.